Inazda · React template
Live Dashboard Starter
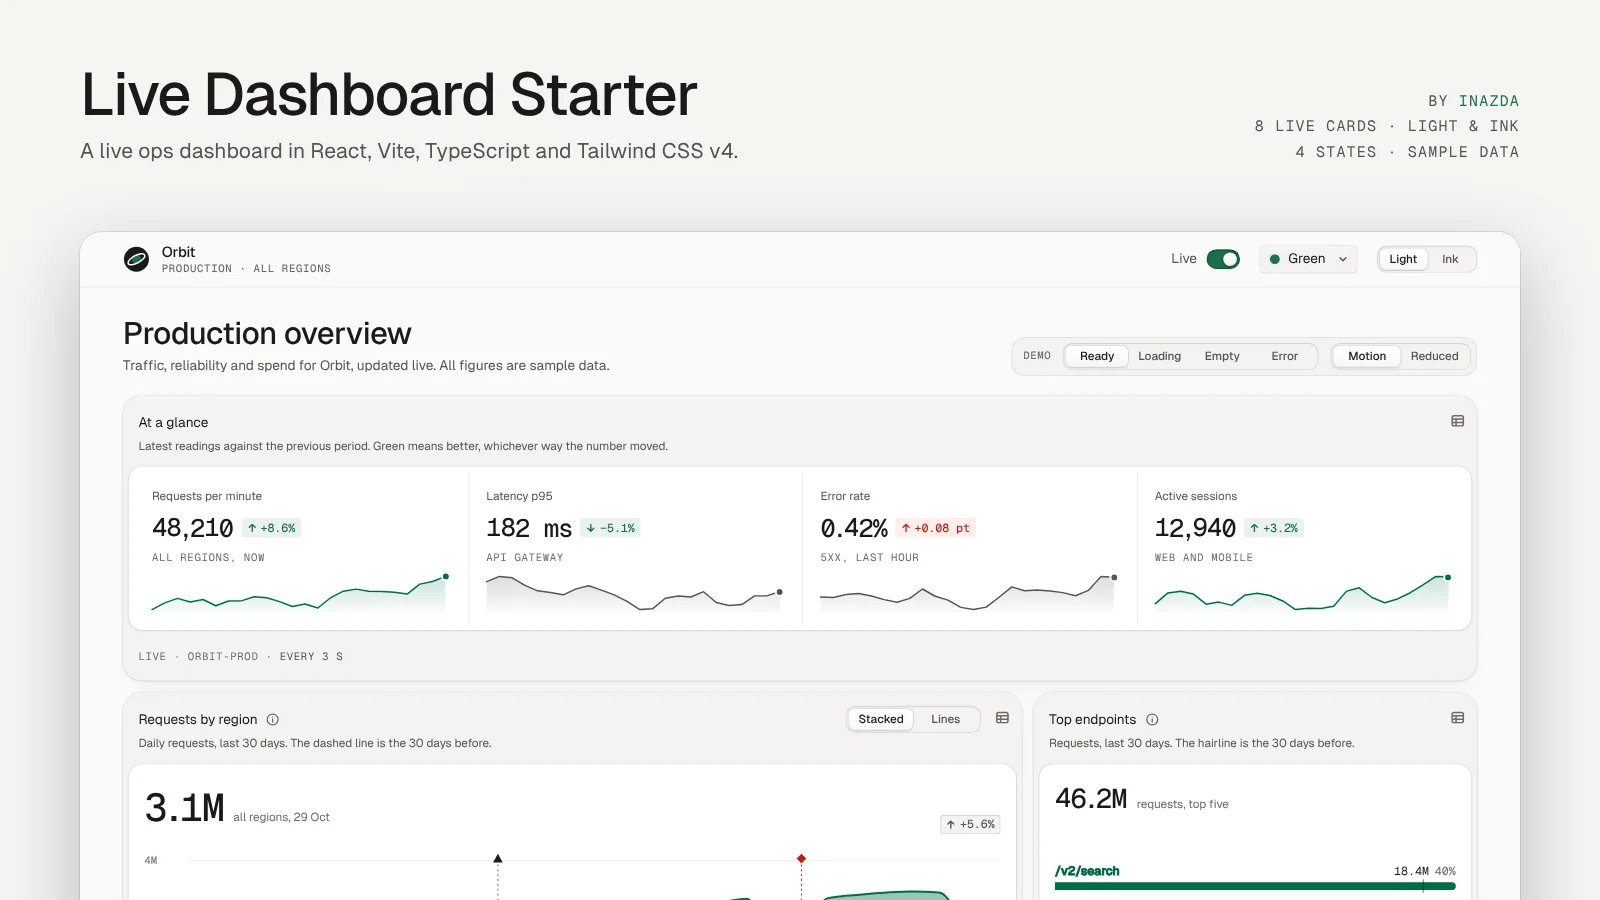
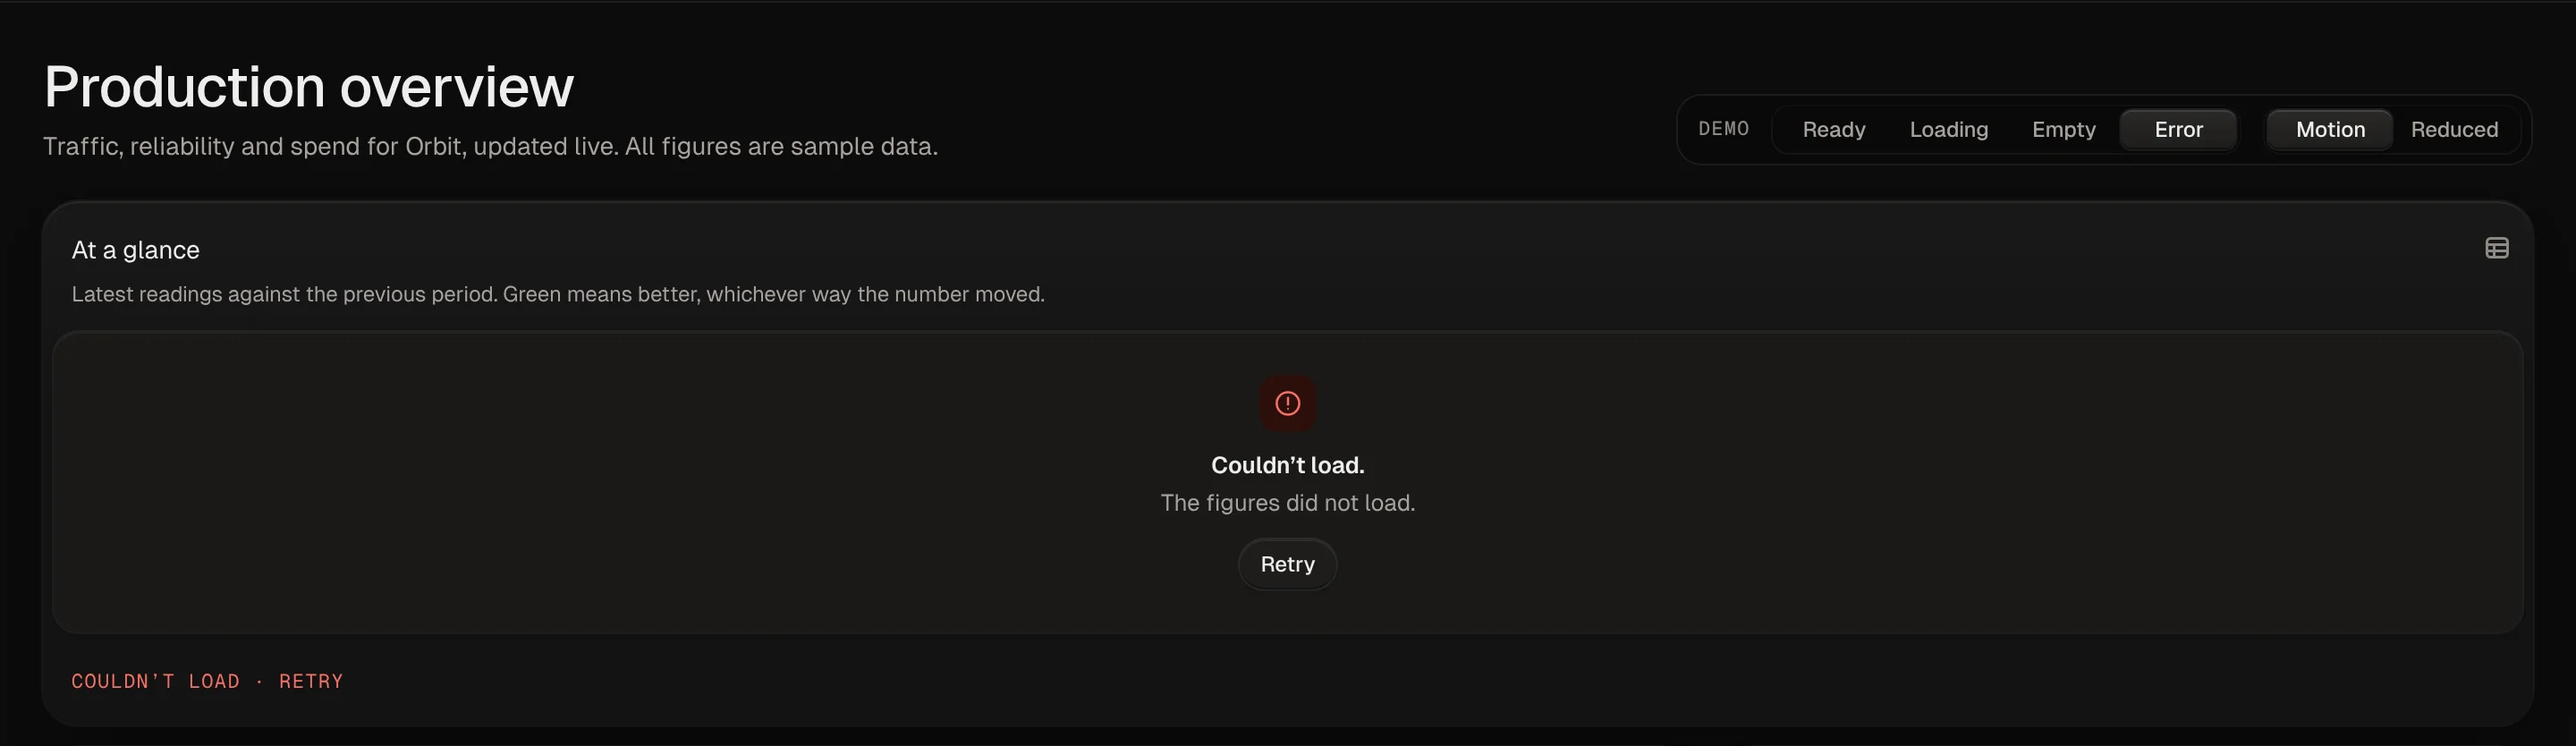
A one-page live operations dashboard you can plug your own API into. Eight chart cards, light and dark themes, and loading, empty and error states that don't make the page jump.
What's inside
KPI tilesRolling digits, a change chip and a sparkline.
Trend chartStacked area or lines, crosshair, toggleable legend, last-period ghost line.
Ranked barsValue, share and a marker for the previous period.
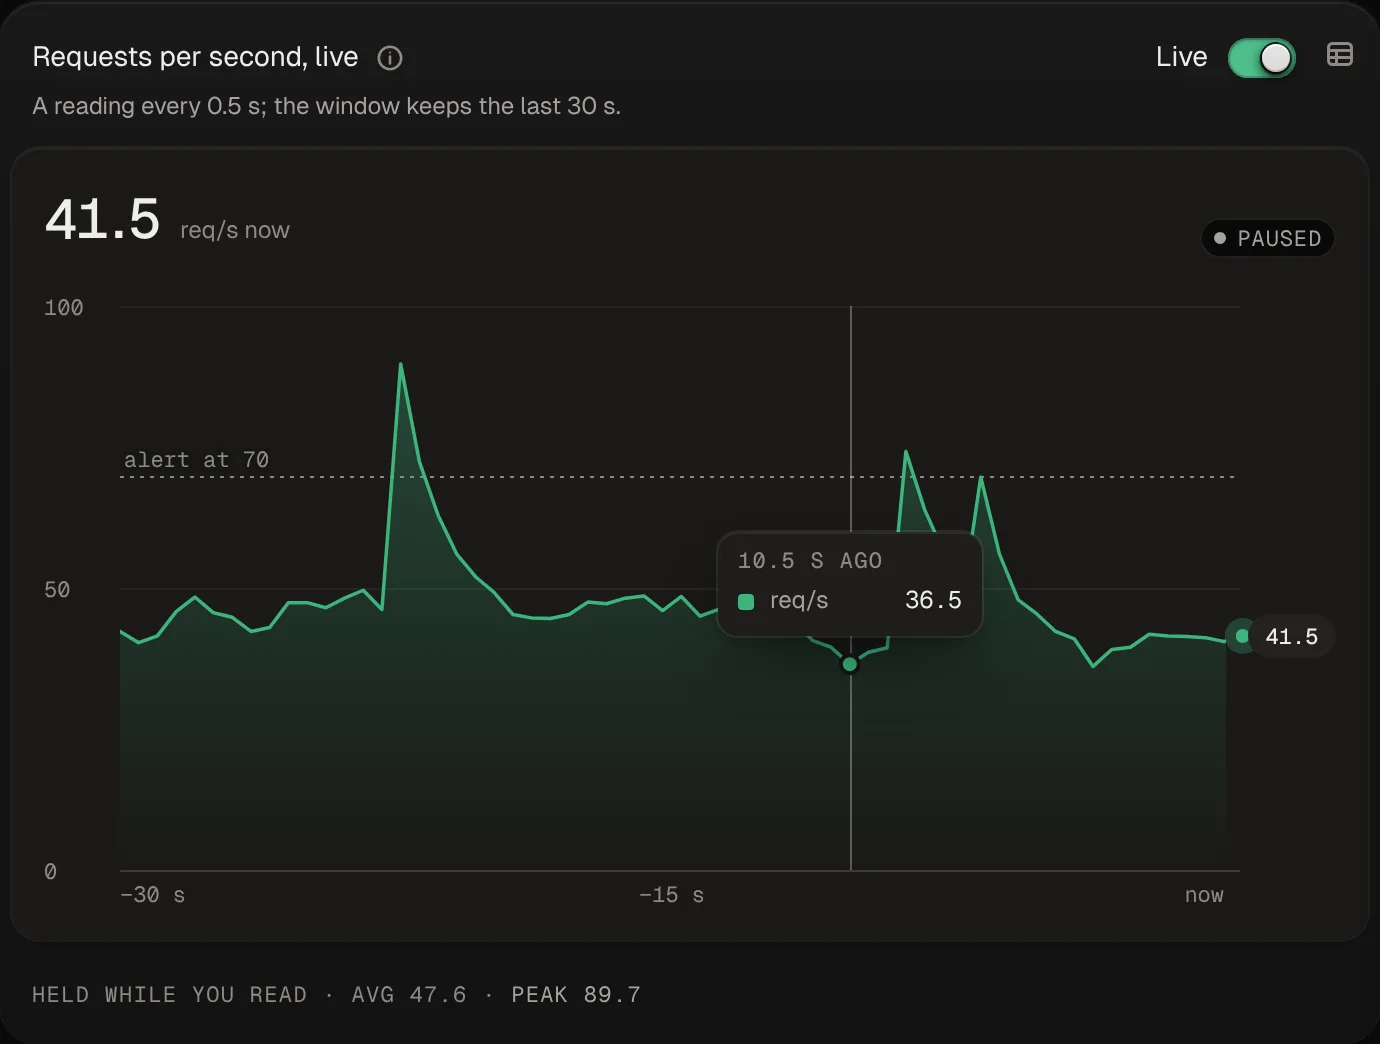
Realtime streamA live line with an alert threshold and a tag on the latest value.
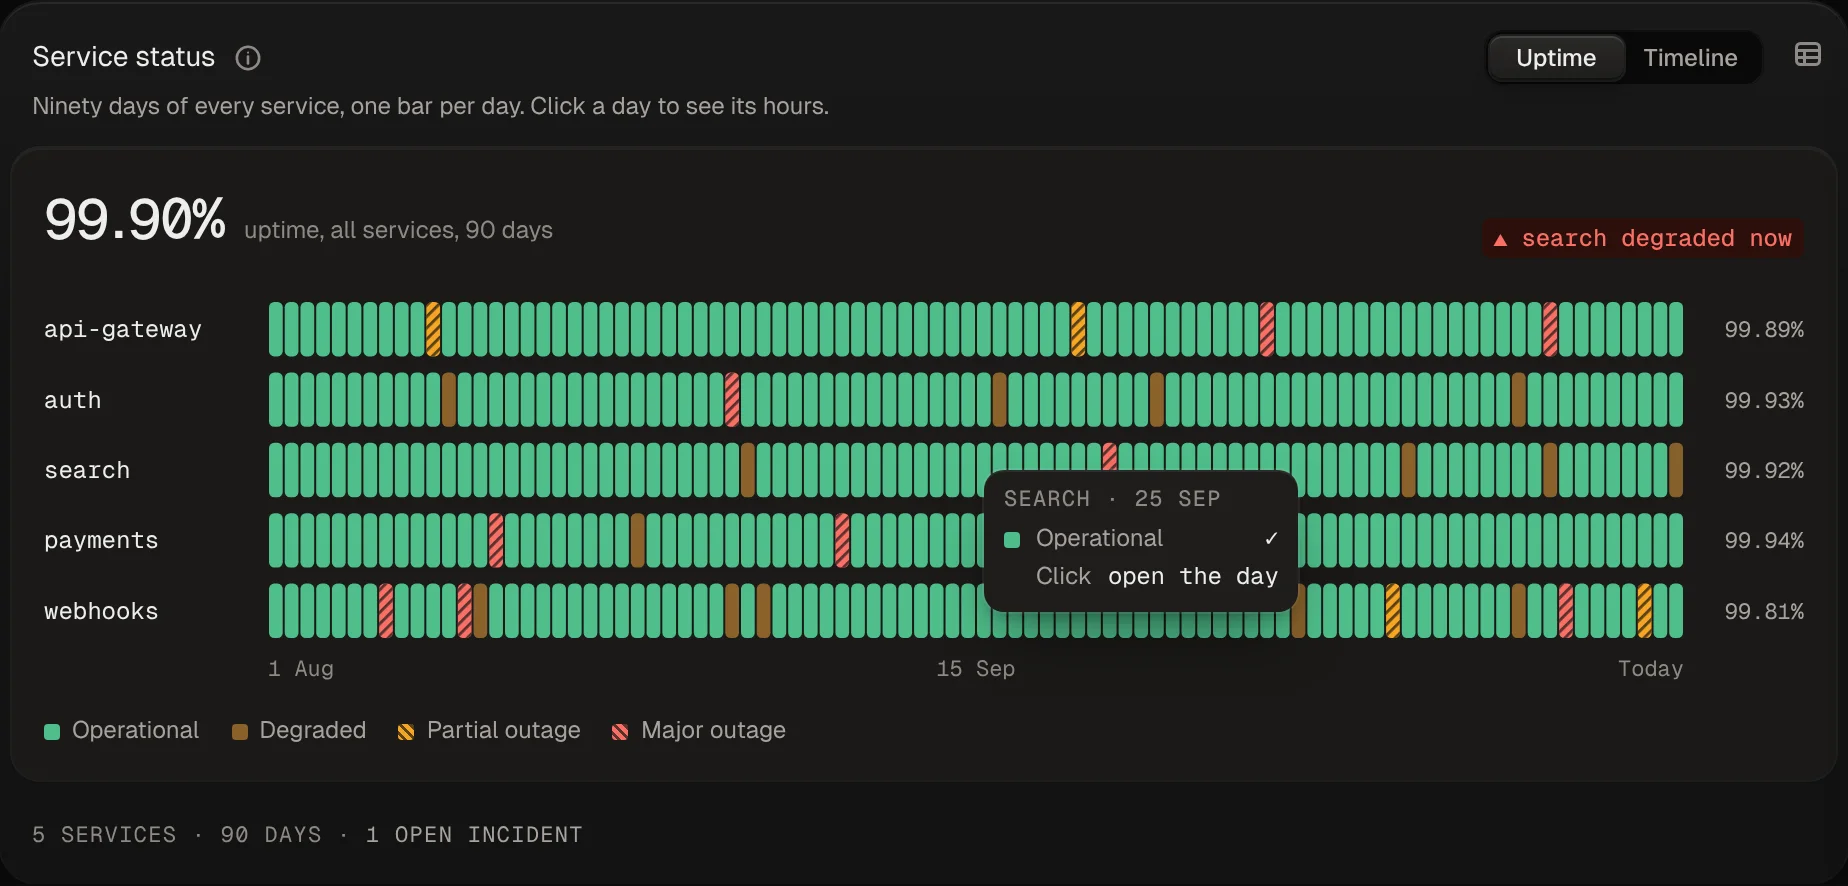
Status strip90 days of uptime per service. Click a day to see its hours.
Quota meterBudget by part, forecast and the day it runs out.
Spark tableSortable rows with sparklines; becomes cards on small screens.
Hex mapOne hex per region with a six-step colour ramp.
Built for real data
- React, Vite, TypeScript and Tailwind CSS v4. No chart library to fight.
- Swap one hook (
useLiveSeries) for your API. Polling and WebSocket examples included. - Every chart can be read as a table and with the keyboard.
- Light and dark themes, seven accent colours, reduced-motion support.
- Number formatting for Rupiah and short units built in.
What you get
- The full source code (zip), ready for
npm installandnpm run dev. - A README with setup, layout and component usage.
- Use it in your own and client projects. Reselling the template itself is not allowed (see LICENSE.md in the zip).
The demo runs on made-up data for a fictional API product.